In this view, you can pull up reports to check month over month progress of objectives at each level. Depending on the filters you have used, system shows you the graph on month over month progress of each objective. The x-axis shows the number of months passed, Y-axis shows the progress of objective.
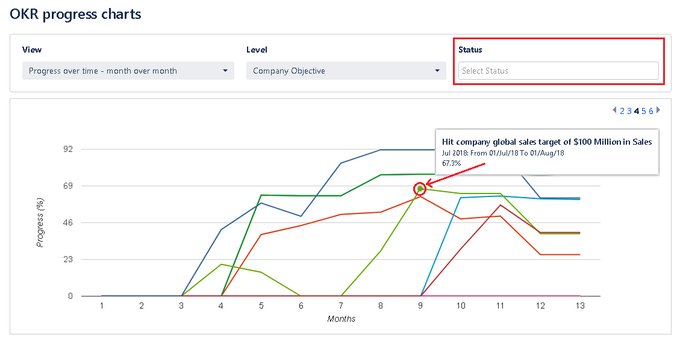
Company level OKRs progress chart
As shown in the image below, each graph shows the progress of an objective every month. If there is a progress update in a month, it is marked with a point, depending on the progress percentage changes the graph keeps taking those curves. On mouse over, every month's progress is shown with details like - objective title, month, start and end dates of the month & current objective progress on each point (curve).
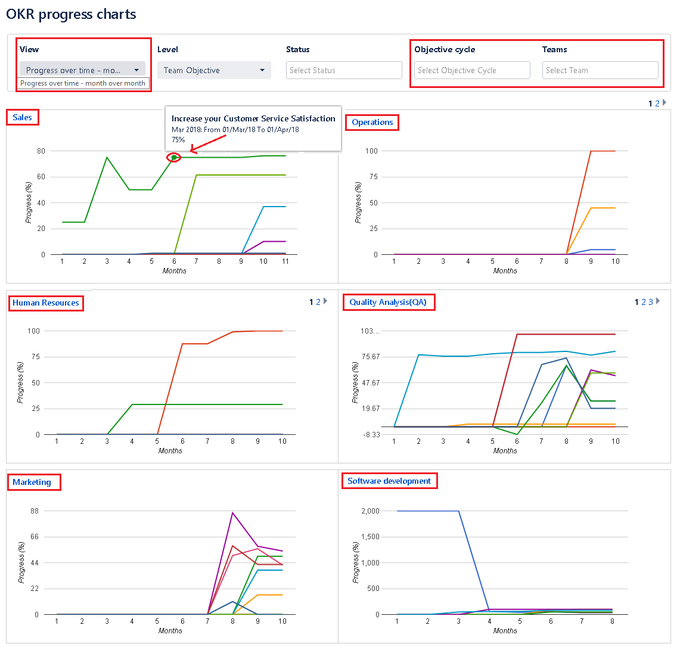
Team level OKRs progress chart
Progress chart at team level shows teamwise monthly progress of each objective. Mouse over to see details of the objective like - objective title, month, start and end dates of the month & current objective progress on each point (curve). You can also make use of filter options like teams and objective cycle for more specific progress data. If there is a progress update in a month, it is marked with a point, depending on the progress percentage changes the graph keeps taking those curves. 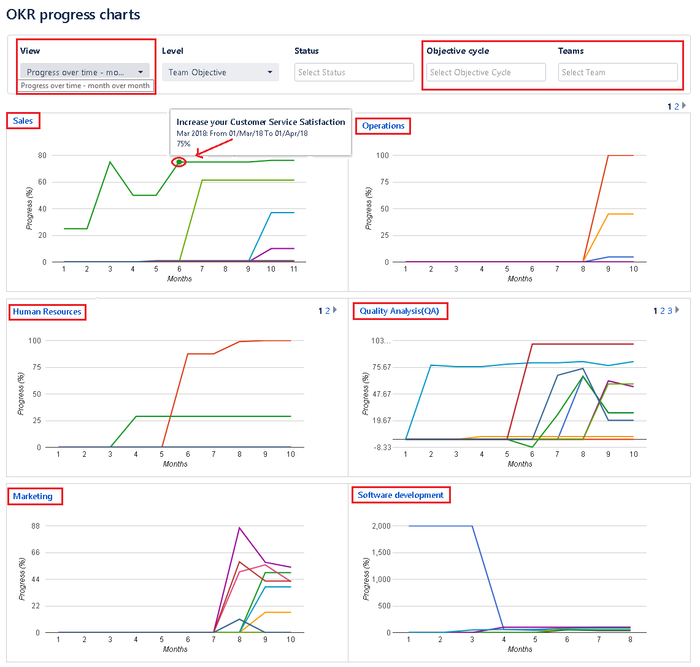
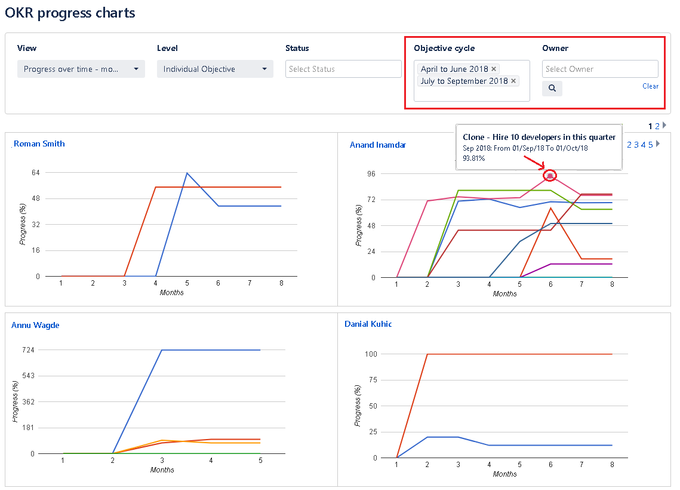
Individual level OKRs progress chart
Progress chart at individual level shows the user-wise monthly progress of each objective. Mouse over to see details of the objective like - objective title, month, start and end dates of the month & current objective progress on each point (curve). You can also make use of filter options like teams and objective cycle for more specific progress data. If there is a progress update in a month, it is marked with a point, depending on the progress percentage changes the graph keeps taking those curves. 
A few quick facts about progress over time - Month over month
Number of months and the latest progress updates on the graph are varied depending on the following situations -
The first month on the progress chart is added as per the oldest start date on an of an objective.
The latest month on the chart is shown in the progress chart according to the nearest due date of the objective.
If there are a few objectives on the chart those are in closed, carried forward, abandoned status then farthest due date among them is considered as for the latest month on the chart. This is because due dates of objectives in these statuses are in past.
If objectives are only in ready, in progress, scheduled statuses, then the current date is considered to add the latest month on the chart. This is because objectives in the mentioned statuses will have their due dates in future.
On this page
| Table of Contents |
|---|
In this section
| Child pages (Children Display) | ||
|---|---|---|
|