Default dashboard
When user navigates to dashboards from the main/side menu. they land on a default dashboard if you have not created your custom dashboard.
Let us see what all details this default dashboard is showing
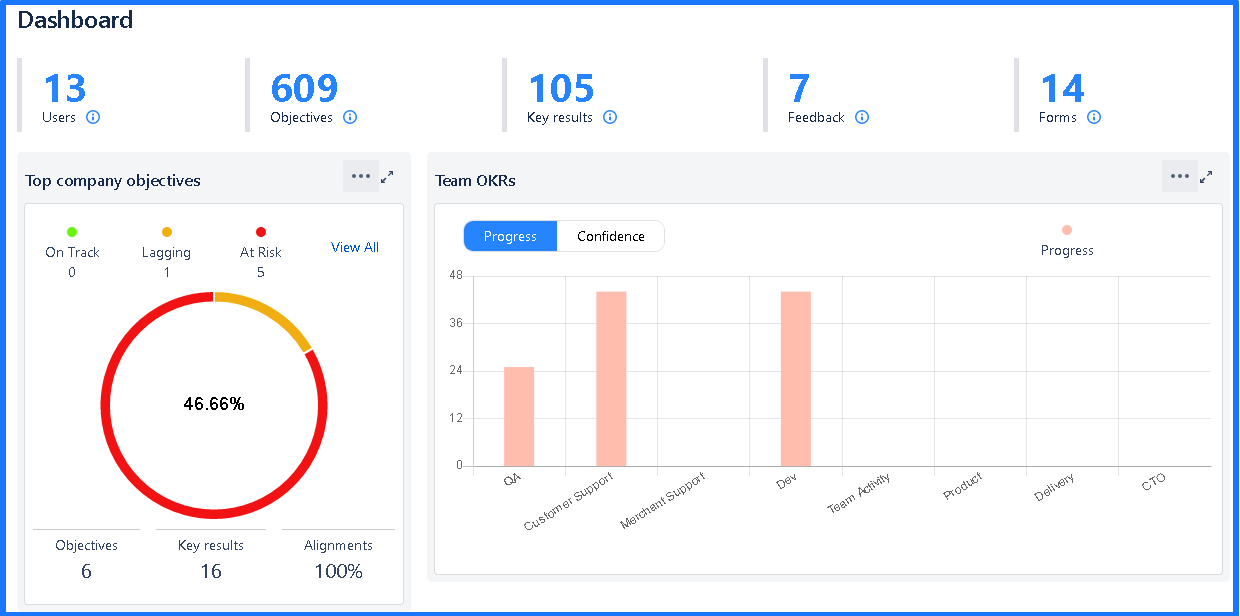
Numbers at the top of the page

This section shows you a total number of a few attributes, like total active users within UpRaise, total objectives at all levels, total key results, total feedback messages exchanged, and total forms within the system. One can get a clear idea of how efficiently the organization is using the system as well as keep an eye on how frequently numbers are growing in a certain period.
Top company OKRs progress
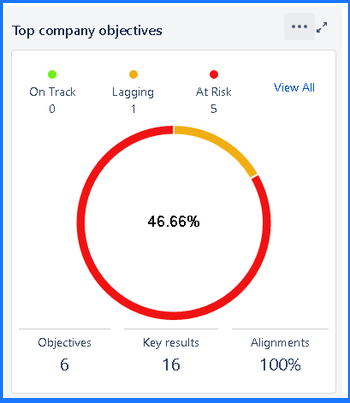
In this section, at the top you can see the overall progress of top company OKRs. It shows the number of OKRs those are on track, lagging or at risk (for the OKRs that are in progress or ready status at the top of the objective hierarchy ). The same data, can be seen with the chart with an overall percentage of completed OKRs. Please make a note that this data is only about OKRs (top ones in objective alignment/hierarchy) at company level.
At the bottom in the image above you can see numbers. Total number of company objectives at the top level. Total number of KRs against those objectives and how many of these objectives are aligned at the same or lower level.
View all link takes you to the company OKRs on the browse OKRs page. Mouse over at the top right corner of the section to refresh or minimize this section.
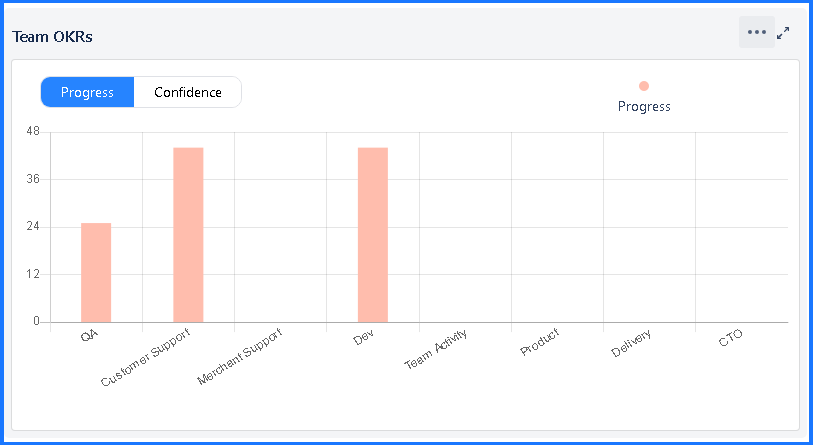
Team OKRs
In team OKRs section, there are two different views i.e. progress view and confidence view.
Progress view
In this view, one can see the overall progress of team-level goals across the company. Mouse over on the progress bars and you will see the average progress of all OKRs assigned to that specific team.
Mouse over at the top right corner of the section to refresh or minimize this section. This section is handy for comparing progress made by different teams on their respective team OKRs.
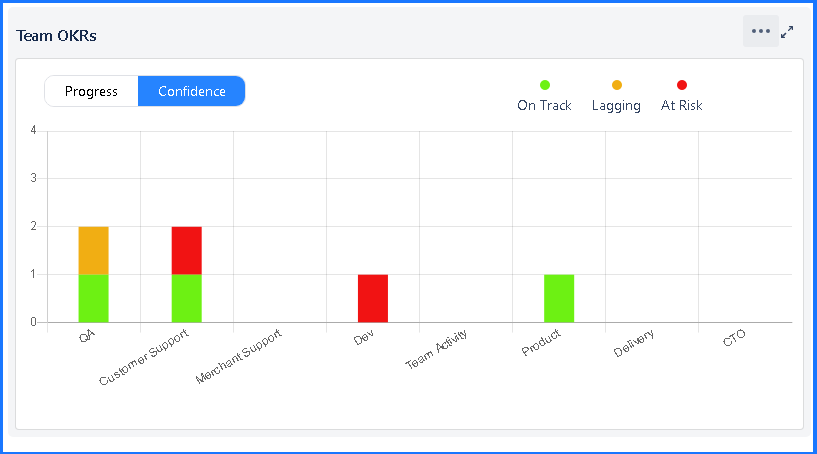
Confidence view
In this view, one can see the confidence statuses of team OKRs across the company. Once you hover over each bar in its different color sections you will be able to see how many OKRs are at risk, on track, or lagging in each team.
Custom dashboards
Based on what you want to track and showcase on dashboards, UpRaise allows you to create custom dashboards using OKR gadgets. Let us see what all gadgets are supported and how to create dashboards.
Supported Gadgets
Currently there are three gadgets available to create custom dashboards.
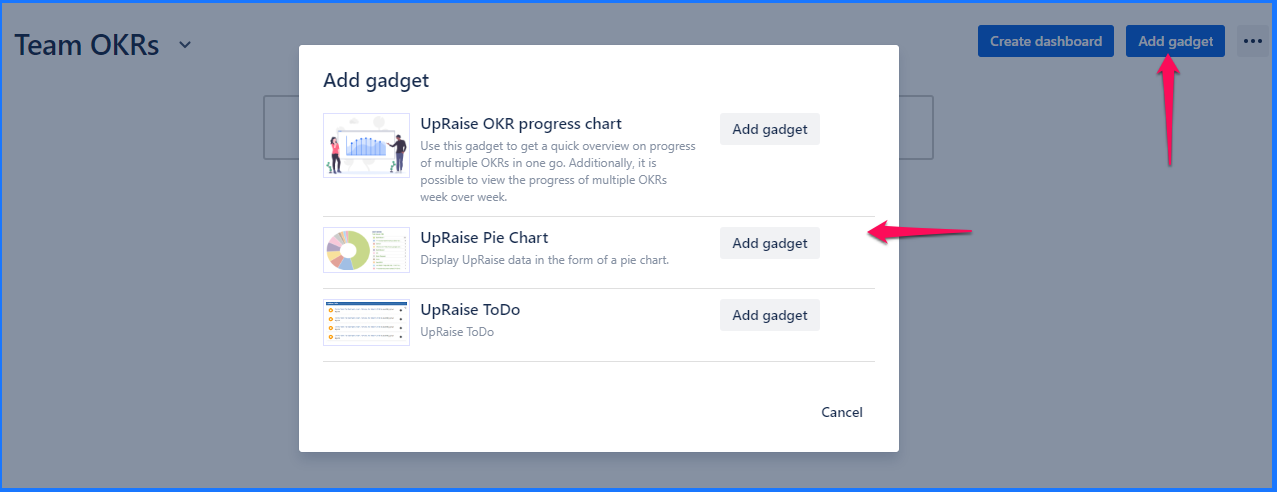
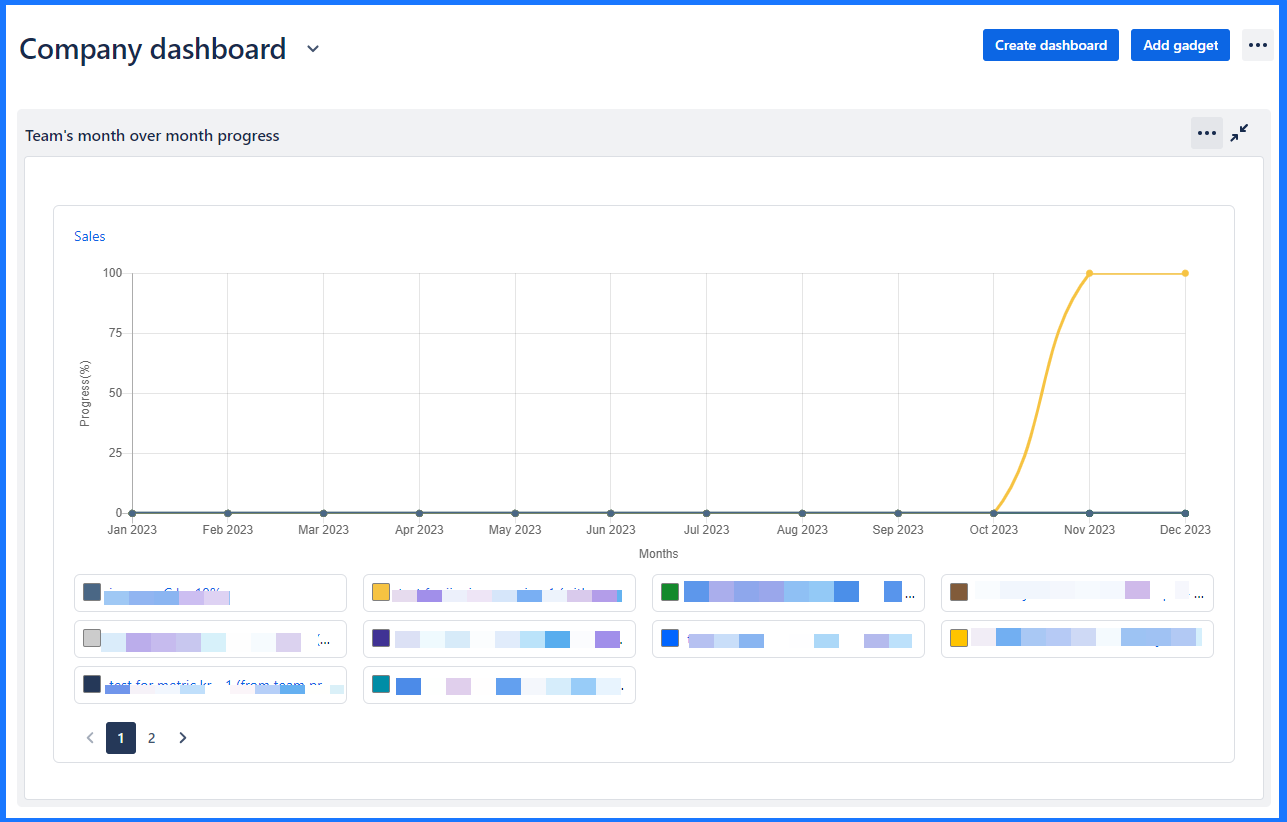
UpRaise OKR progress chart
This gadget will give a quick overview of progress of multiple OKRs like current progress, or progress over weeks, months, quiarters.
Fiels | Possible values | Description |
|---|---|---|
Name | Name of the gadget |
|
Description | Description about the gadget | |
View |
| Select one of the given progress view |
Level | Objective level | Select relevant objective level based on use case |
Status | Objective statuses like Ready, In progress, Scheduled, Closed, etc. | |
Objective cycle | Objective cycle available in the app |
UpRaise Pie Chart
This gadget generates pie charts based on different OKR views created on browse tab and statistic type.
Fields | Possible values | Description |
|---|---|---|
Name | Name of the chart | |
Description | Description of the chart | |
Module | OKRs and Company directory | One can select one module at a time and add another gadget on dashboard for the same or different module |
Filter/views | OKR views or User segments based on what module is selected | It shows the OKR views in drop-down if OKR module is selected. User segments are listed when Company directory module is selected. |
Statistic type | Different statistic types that are basically attributes of OKRs/company directory | Progress, Status, Owners, Teams, etc. for OKRs module. UpRaise role, Manager, Designation, etc. when company directory module is selected. |
OKR module

Company directory module

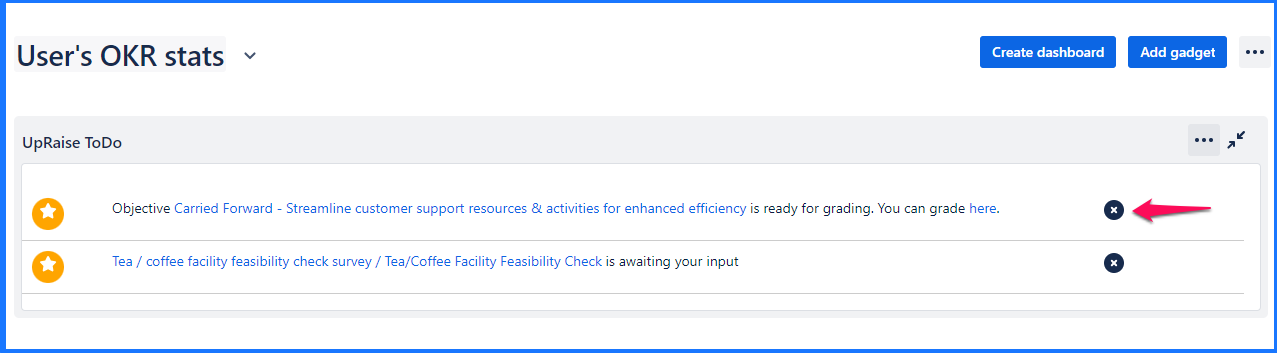
UpRaise ToDo
This gadget is for a To Do list. This shows the to do’s related to OKRs. You can dismiss the To do item once you have taken the necessary action.
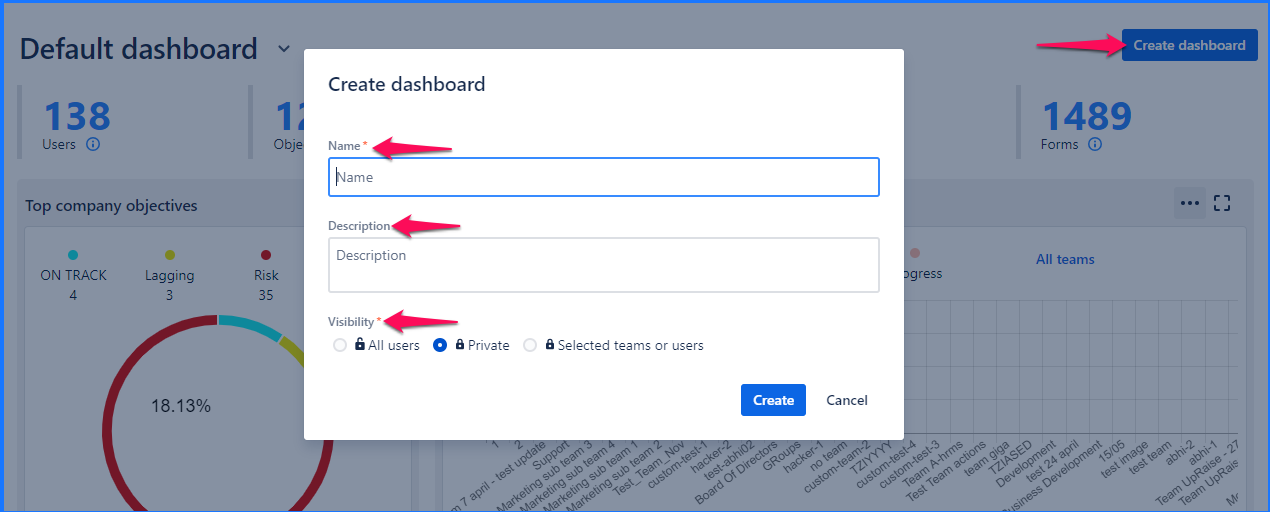
Create dashboards
Click on Create dashboard >> Enter Dashboard Name, Description, and Visibility.
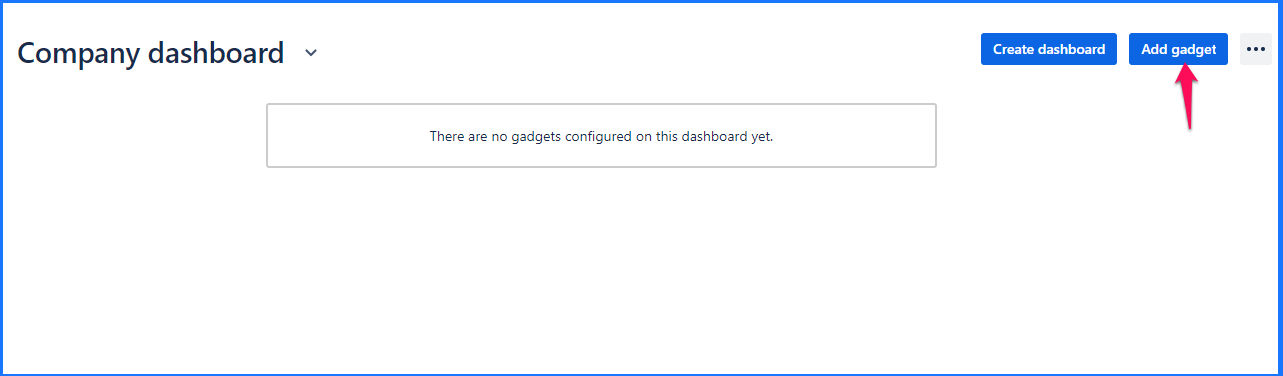
Click on Add Gadget
Select the gadget of your choice. Fill in the details and save. You can add multiple gadgets on one dashboard. For example, you create a pie chart for different statistical types or you want to create OKRs charts based on different durations types like weekly, monthly, etc.
On this page