Additional filters for 'duration & date' type profile attributes
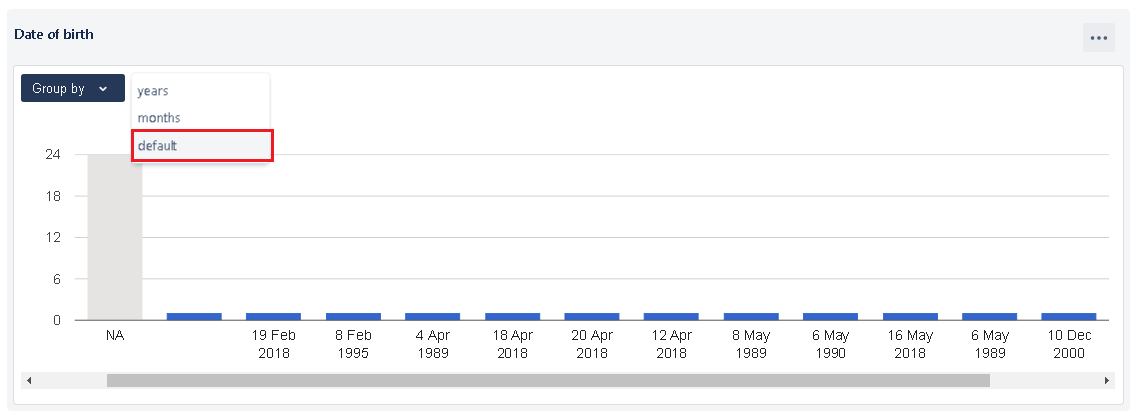
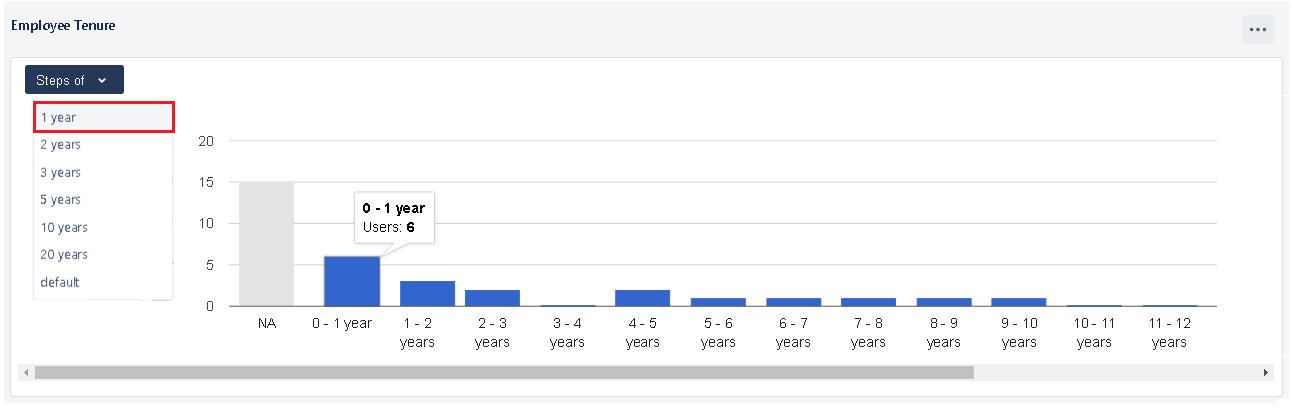
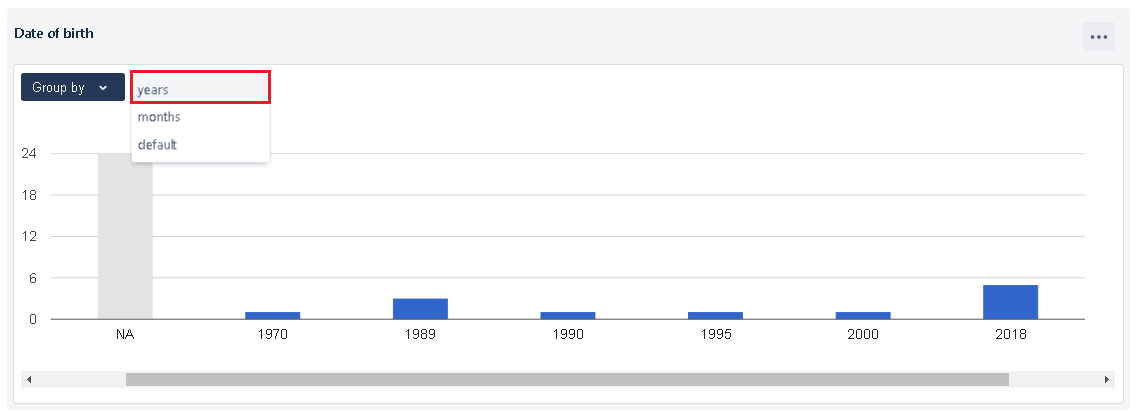
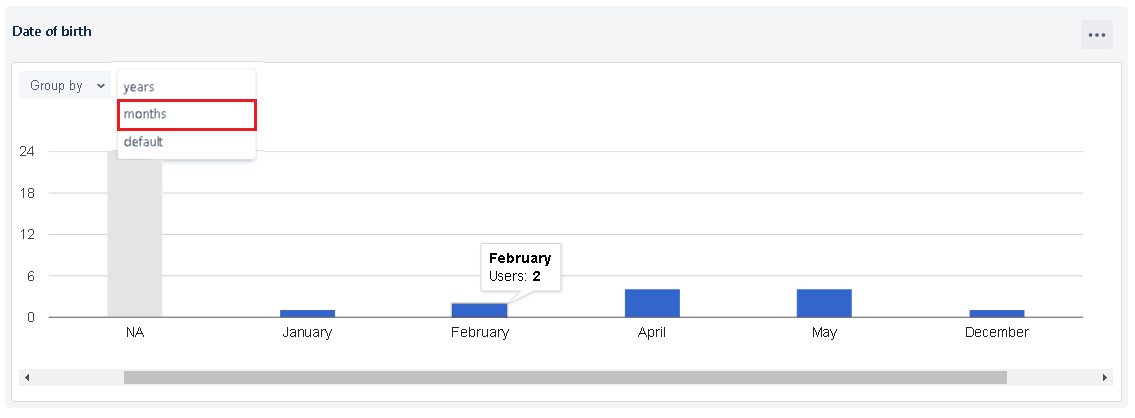
In your profile sections, you will definitely have some attributes those provide a values in durations or dates. Example, age, date of birth or tenure of an employee, etc. basically anything that talks about durations and dates. To view reports on such attributes, UpRaise reports are enhanced with some additional filters. In below images, you can see filters called 'steps of' or 'group by', filters are to get analyzed data grouped by the different ranges. Filter options for duration related profile attribute will have ranges like 1, 2, 3 and so on. Notice the image below, the data is filtered with option - one year hence, the range is 0-1 year, 1-2 years & so on. x-axis shows the number of years in selected range. y-axis shows the number of employees in the particular range of the years. As per below image - 6 employees fall under 0-1 year range of the tenure in the organization. So you will be able to track number of employees for a particular range of years. Hover over on every bar to see number of employees in different ranges. Whereas, in this image, the selected filter option is two. Hence, the year rage is 0-2 years, 2-4 years and so on. When you have some attributes related to dates like date of joining, date of birth, etc. System shows up different type of filter for such report section. In the below image, a filter called 'group by' allows you to analyze data with months, years & default options. It only shows the year-wise data, which means the graph will show number of employees whose birthdays fall under in the specific year. x-axis values will be years such as 1990, 1991, 1992 etc y-axis shows the number of employees whose birthdays fall under a particular year. This filter option shows month wise data, that is number of employees whose birthdays fall under a specific month. The year parameter is ignored completely in this filter. x-axis values will be months from January to December (year will be ignored completely). y-axis shows the number of employees whose birthdays fall under a particular month. This filter will take all the birth dates as it is from the system and show up the number of employees for each birth date. x-axis values will be the exact birth dates available in the system. y-axis shows the number of employees whose birthdays are on given dates. Date related reports are only available in bar charts.Filters for duration related profile attributes
Data in this report is not limited to any range or number employees, it will generate a report depending on the exact data you have in your system. Eg. if you have 1000 employees who are working for 1 year in the organization, system is capable enough to track that. 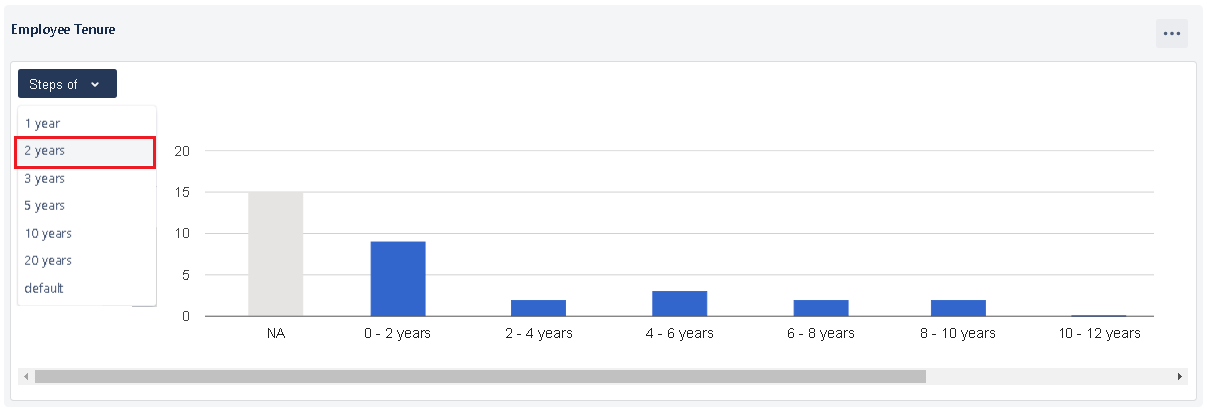
You can also view the same report with pie chart by editing the report.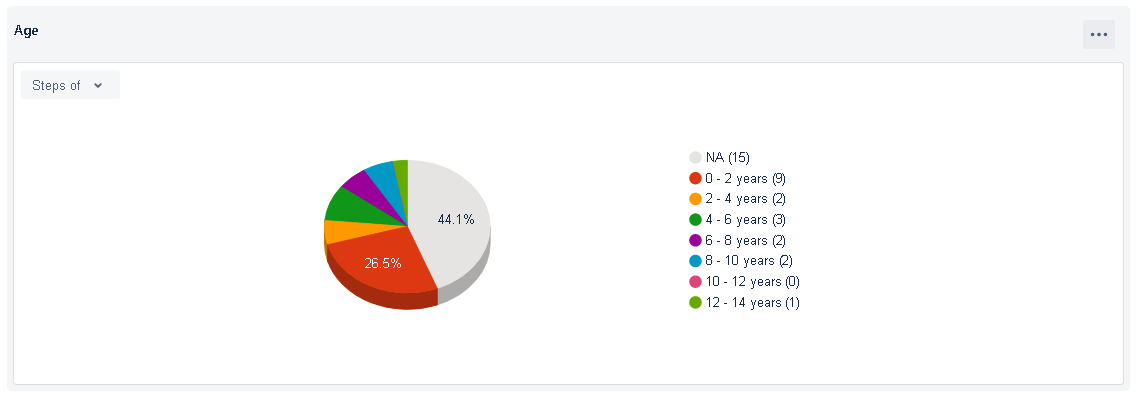
Filters for date related profile attributes
Years
Months
Default