Company dashboard (Before v3.8.6.2)
- Annu
Analytics
This is how a company dashboard page looks like.
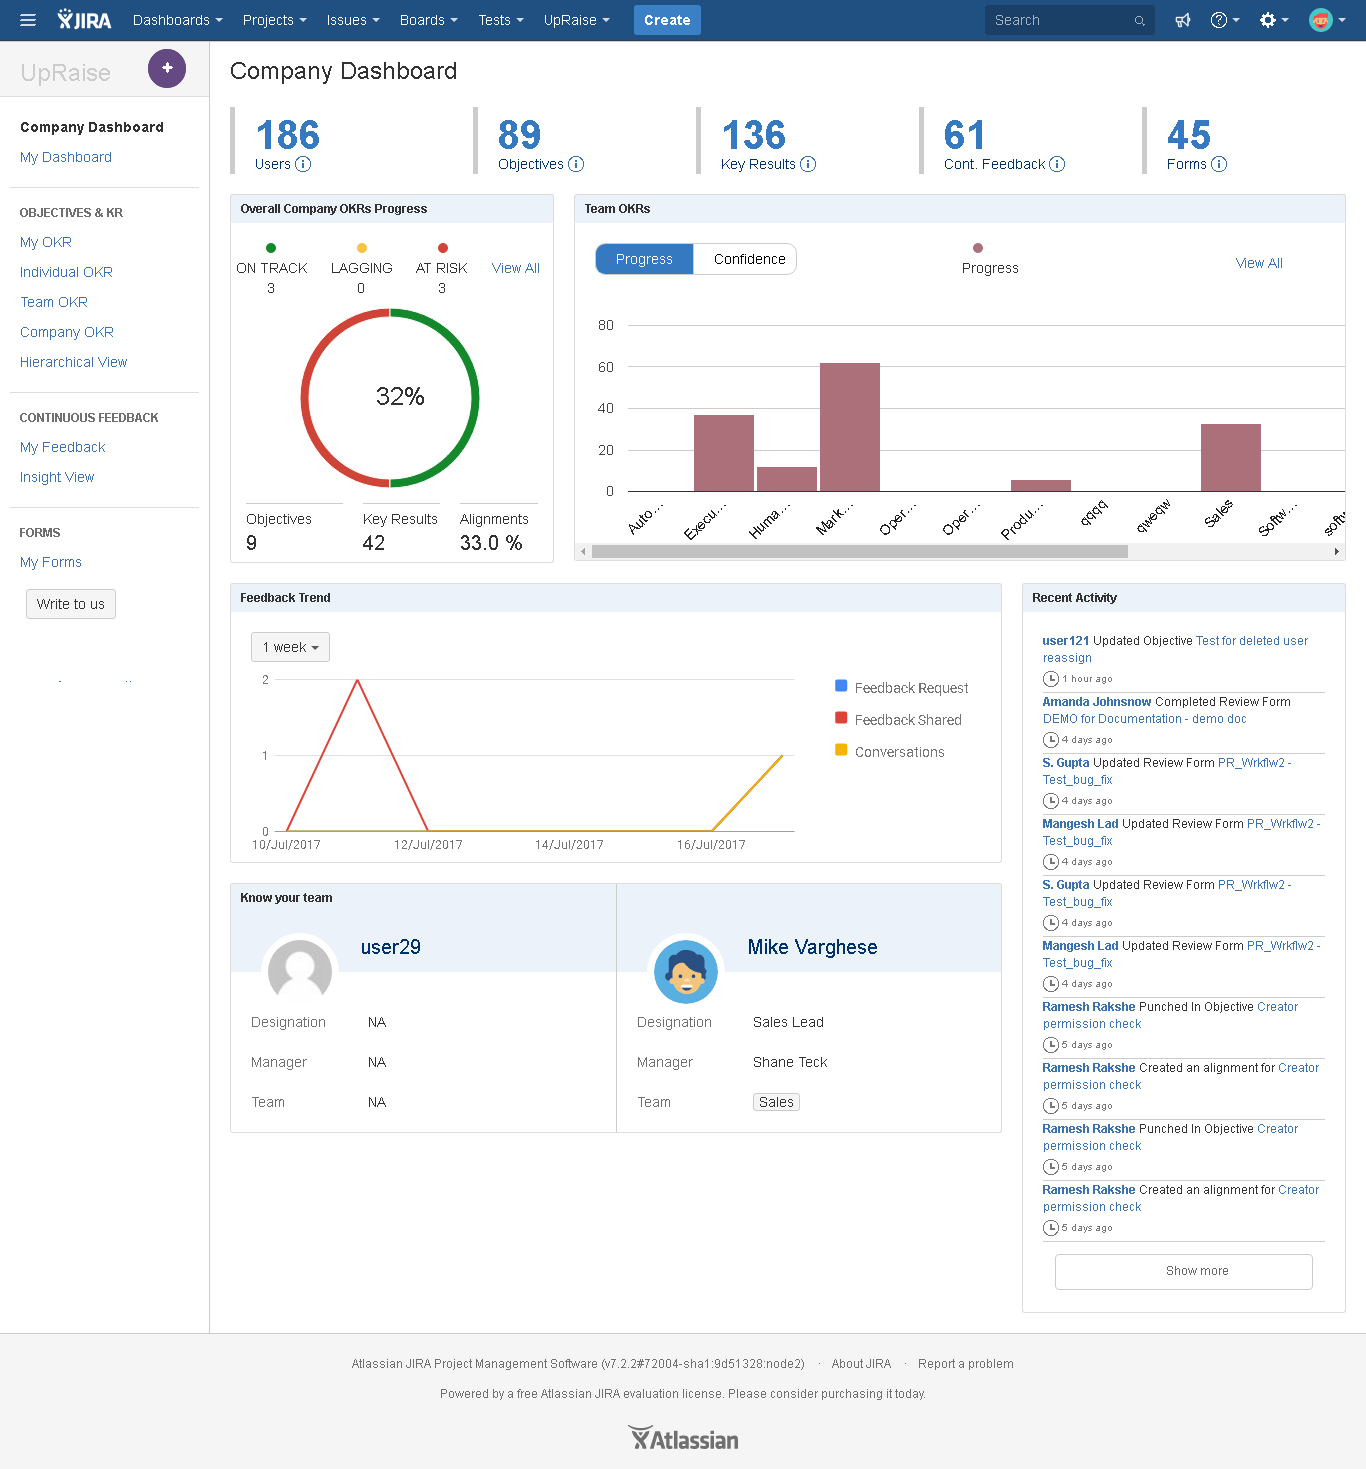
Let us all sections one by one.
Numbers at the top of the page
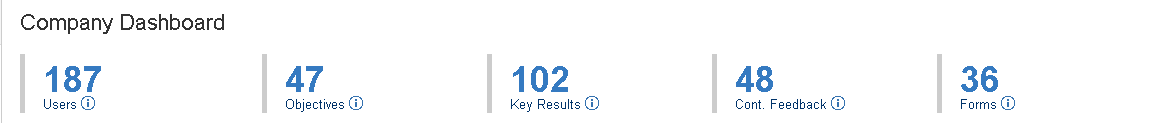
This section shows you a total number of each attribute like total active users within Employee Success, total objectives at all levels, total key results, total feedback messages exchanged and total forms within the system. One can get a clear idea how efficiently the organization is using the system as well as to keep an eye on how frequently numbers are growing in certain time period.
Overall company OKRs progress
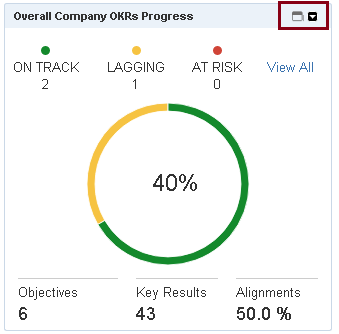
In this section, you can see overall progress of company OKRs. It shows the number of OKRs those are on track, lagging or at risk (for the OKRs those are in progress or ready status), as well as same data, can be seen with the chart as with an overall percentage of completed OKRs. Please make a note that this data is only about OKRs at company level.
At the bottom in the image above you can see numbers. Total number of objectives at the company level. Total number of KRs against those objectives and how many of these objectives are aligned at the same or lower leve.
Apart from that 'view all' link takes you to the company OKR page. The highlighted icons, first is to maximize the section and second is to minimize or refresh the section.
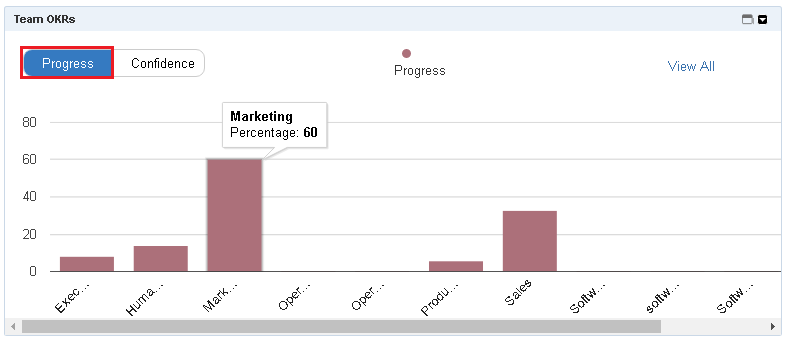
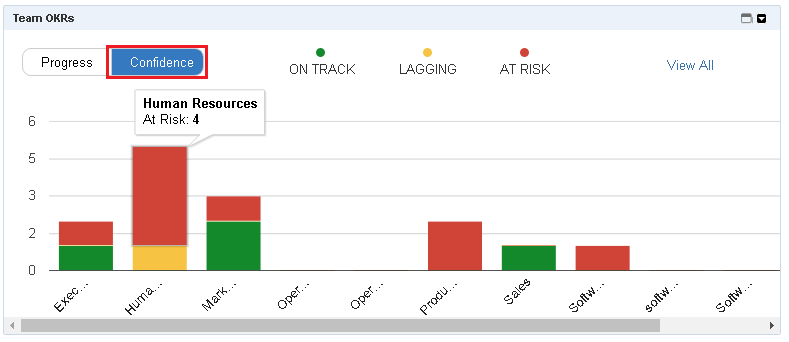
Team OKRs
In team OKRs section there are two different views, i.e. progress view and confidence view.
Progress view
In this view, one can see the overall progress of team level goals across the company. Click on view all link to navigate to team OKRs page. To refresh or minimize/maximize this section, use icons at the top right corner of the section. This section is handy for comparing progress made by different teams on respective team OKRs.
Confidence view
In this view, one can see the confidence statuses of overall team OKRs across the company. Once you hover over each bar in its different color sections you will be able to see how may OKRs are at risk, on track or lagging in each team.
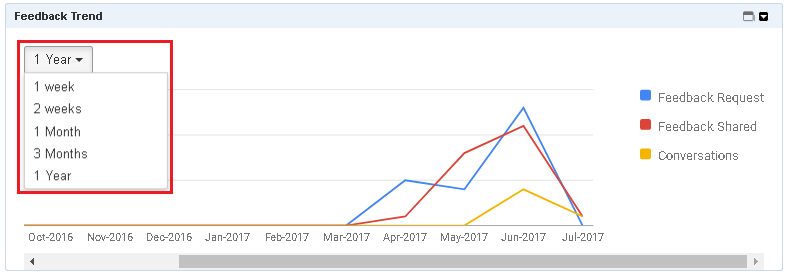
Feedback trend
This section helps you understand the feedback trend in the organization for different durations. This graph shows you the trend of feedback requested & shared as well as the conversations.
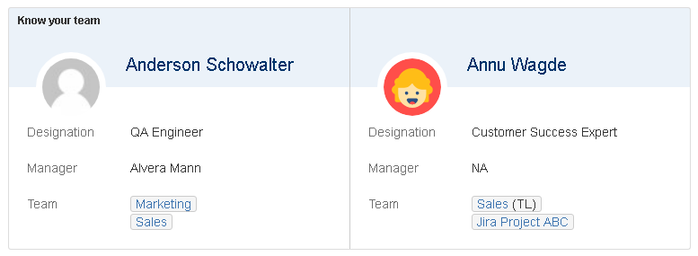
Know your team
This section simply helps you know your colleagues better. When you refresh the section or entire page it shows information of two Employee Success users randomly.
Recent activity
This section lists all activities of other Employee Success users.
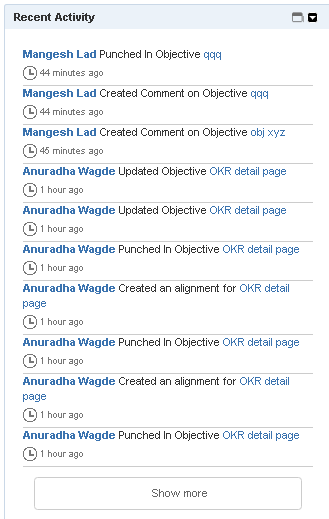
On whichever page they have taken an action will be given in the link. After clicking on that link information will be visible to you according to the access permissions.
On this page
In this section
- Dashboards
- How to create new or manage existing JIRA dashboard ?
- UpRaise ToDo gadget
- What is Employee Success (UpRaise) feed gadget?
- What is individual OKRs compliance gadget?
- What is team OKRs compliance gadget?
- What is UpRaise objective cycle - individual OKRs gadget?
- What is UpRaise objective cycle - team OKRs gadget?
- What type of gadgets are available within UpRaise?